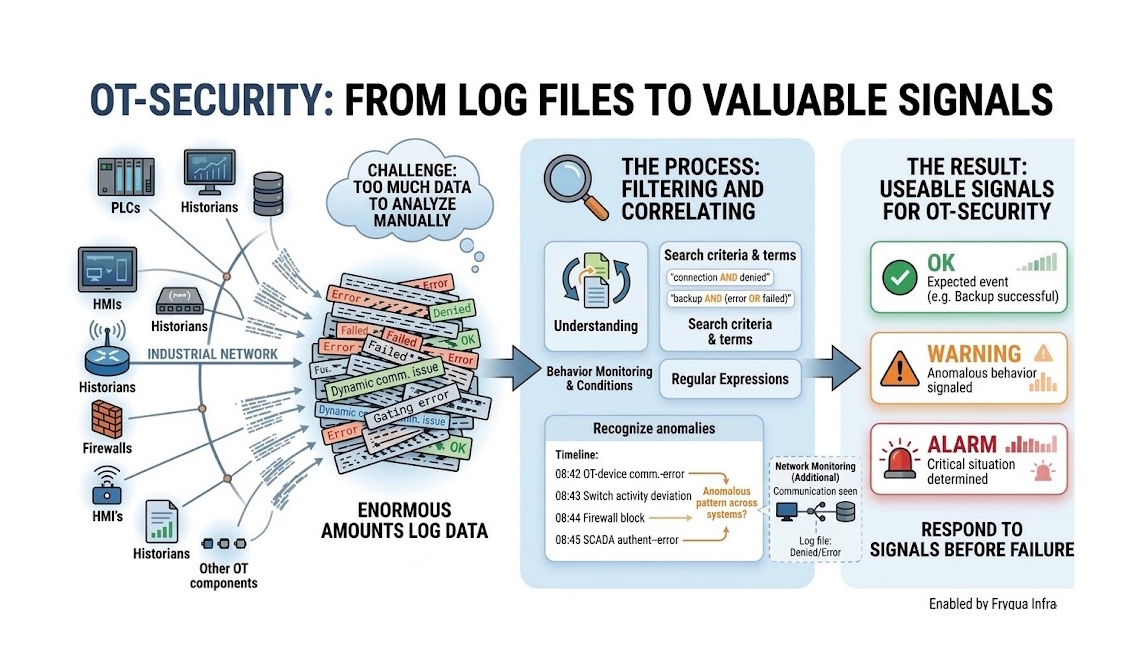
An industrial network can nowadays produce enormous amounts of information. PLCs, SCADA systems, HMIs, switches, routers, firewalls, VPNs, historians and other OT components continuously write information to log files. That is good news in itself, because every log entry tells a little piece of the story.
The problem arises when so much information is produced that nobody is able to actually look at it anymore. And that is precisely where an interesting blind spot in OT security can emerge. You do not have to read every log entry. You also do not have to analyse every network packet manually. But you do need to be able to extract relevant signals from your OT environment.
Because a system does not have to fail before something is wrong. Sometimes, the system is already telling you. You just have to listen.
OT keeps running while all kinds of things are happening
An important difference between traditional IT and OT is that availability is often extremely important. A production line cannot simply be shut down to perform a security update. You do not replace a PLC just because a new software version is available. And some industrial systems run for years with the same configuration. This also means that, when it comes to OT security, you cannot rely exclusively on traditional security measures.
Above all, you want to know what is actually happening on your OT network. Organizations are increasingly looking at network traffic and behavioural anomalies. But there is another source of information that is often overlooked: the log files produced by the systems themselves.
A log file is actually a sensor
At first glance, a log file may seem like just a text file. But technically speaking, it is a collection of observations of what a system has experienced. For example, a firewall can record that a connection has been denied. A switch can report that a network connection has gone down. A SCADA system can register a communication problem. An HMI can report an authentication error. A server can report that a service has stopped unexpectedly. A PLC-related system can register a communication or device error.
Every individual notification does not necessarily mean anything unusual. But several notifications together can paint a very different picture. Moving from thousands of log entries to relevant signals is therefore a challenge.
Imagine that an OT firewall logs every minute which connections are allowed and denied. This can quickly result in thousands of entries per day. The logs from switches, servers, SCADA systems and other components are added to that. It is not realistic to expect an administrator to assess every log entry.
You therefore need a mechanism that can distinguish between normal information and information that deserves attention. This does not always have to be complicated.
Log rotation makes monitoring more difficult
OT environments also have to deal with different types of log files. Some log files continue to grow, others are periodically overwritten, and still others are automatically rotated as soon as they reach a certain size.
A monitoring solution must therefore not only be able to search for text, but also understand how these files are handled. For example, Fryqua Infra automatically detects when a growing log file becomes smaller. This may mean that the log file has been rotated and a new file has been created.
Monitoring can then start again from the beginning of the new file. That may sound like a technical detail. In a production environment, these are precisely the kinds of details that matter. A simple combination can already be valuable: connection AND denied. But you can also search more specifically: backup AND (error OR failed).
Or search for a specific error message, event or pattern. The advantage is that you do not have to wait until a system actually fails. You can respond to the signal that precedes it.
Not every notification has to be an alarm
Another problem with log monitoring is the so-called notification storm. Imagine that a system writes the following message every minute: Could not connect to server. If you send every match directly as an alarm, the administrator will receive dozens or hundreds of notifications within an hour. This is not helpful to anyone.
You therefore also need to be able to determine how repeated notifications are handled. With Fryqua Infra, for example, an identical notification can be suppressed for a certain period. You still receive the relevant signal, but not the same notification every minute.
Detecting signals without overwhelming people with notifications.
Not only errors are interesting
An important point about log monitoring is that you do not only have to search for the word error. A successful event can also be relevant.
For example: Backup completed successful can be used as an OK notification. That may seem strange when you think from a security perspective. But it actually provides the opportunity to use monitoring more broadly:
- OK: When an expected event occurs
- Warning: When something deviates from the expected situation
- Alarm: When a critical situation is detected
And this is where OT becomes particularly interesting
In an office environment, a temporary network problem can be inconvenient. In an industrial environment, the same type of event can be part of a much larger problem. For example, consider a production line where different systems communicate with each other.
A single communication error does not necessarily mean anything. But imagine that you see the following events one after another: 08:42 – an OT device reports a communication error; 08:43 – a switch registers unusual network activity; 08:44 – a firewall blocks a connection; 08:45 – a SCADA system reports an authentication error.
Now it becomes interesting. Not because any one of these notifications necessarily indicates a cyberattack. But because the combination of events gives you a reason to investigate further. And that is precisely why log data becomes interesting in OT security. It turns log file monitoring into more than just a way to find errors. It becomes a way to check whether systems are behaving as expected.
Log files alongside network monitoring
Network monitoring and log file monitoring do not have to replace each other. They can actually complement each other. For example, network monitoring can show:
Communication is taking place between these two systems.
A log file can then show:
The system has denied this communication.
Or:
The application reports an error with this connection.
This gives you different perspectives on the same environment. And the more of these signals you can combine, the better you can determine what is normal and what appears to be unusual.
Fryqua Infra: not more log data, but useful signals
This is also where Fryqua Infra comes in. The goal is not to add yet another dashboard where an administrator can view thousands of log entries. The goal is to extract the relevant events from the information that already exists. Search criteria can be defined using labels.
Conditions can be combined using AND, OR and NOT. When necessary, basic regular expressions can be used to identify patterns or values. And notification levels can be used to determine whether an event should be treated as OK, Warning or Alarm.
This allows you to determine very specifically: What do I want to know? instead of: What is in my log file?
The next step: recognizing patterns across different systems
The real value emerges when log data is no longer viewed as a collection of separate events. Because in an OT environment, systems are interconnected. An event on a firewall may be related to a switch. A switch notification may be related to a PLC communication problem.
A SCADA notification may then show the same incident from a completely different perspective. The interesting question is no longer: “Which log entry contains the word error?” but:
“Which combination of events deviates from what we normally see in this environment?”
That is where log file monitoring starts to evolve into behavioural monitoring.
OT security starts with knowing what is happening
You do not have to read every log entry. You also do not have to analyse every network packet manually. But you do need to be able to extract relevant signals from your OT environment. Because a system does not have to fail before something is wrong. Sometimes, the system is already telling you. You just have to listen.